Vernier scale
Here we use the Vernier scale to analyze data from Beads on string drop, a classroom measurement of Earth's gravitational acceleration.
There are two ways to use the resource in the classroom
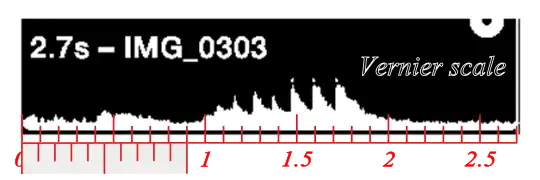
- For a "hands-on" activity with scissors, the figure to the right can be copied, expanded, and printed on a sheet of paper. Students cut out the Vernier scale and measure the times associated with the rising edge of the peaks. These correspond to times when a paperclip strikes the coffee can.
- For a less time-consuming activity, a classroom with internet access could measure the times using the images in the following section.
Both methods recover the data required to experimentally measure g.[1]
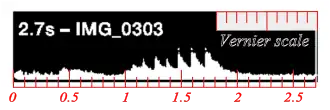
Collecting the data from images with a Vernier scale
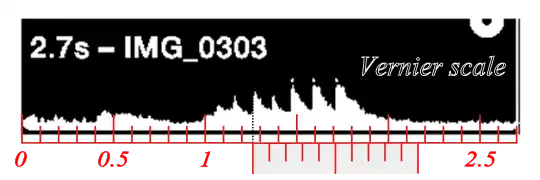
The first figure below shows the vernier at zero. The others verniers are aligned to the vertical dotted line (black) that represent the approximate time when a paperclip struck a coffee can. First guess the time and then hover your mouse over the figure and see if you got the right answer.
-
 0.0 seconds
 -
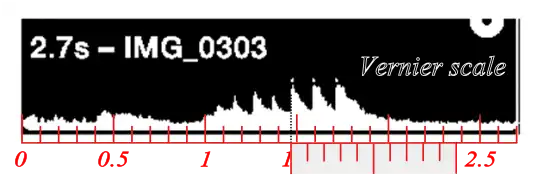
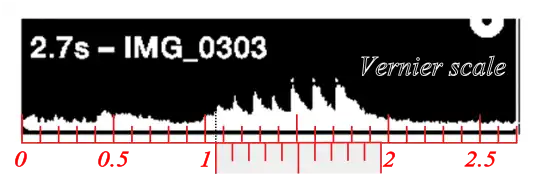 1.06 seconds
 -
 1.15 seconds
 -
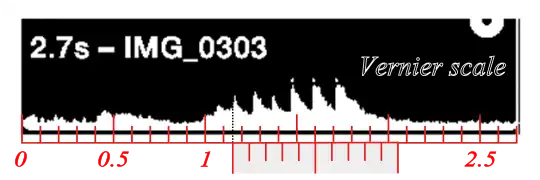
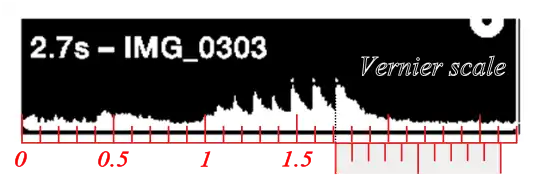
 1.26 seconds
 -
![1.37+ seconds [2]](./Paperclips_on_string_drop_sound_data_5.svg.png) 1.37+ seconds [2]
1.37+ seconds [2] -
 1.47 seconds
 -
![1.59− seconds [3]](./Paperclips_on_string_drop_sound_data_7.svg.png) 1.59− seconds [3]
1.59− seconds [3] -
 1.71 seconds
- ↑ See Physics and Astronomy Labs/Beads on string drop
- ↑ The reader might notice that the value is a bit higher than 1.37
- ↑ The reader might notice that the value is a bit lower than 1.59